Оценка индекса Джини
In this diagram, you can see the income distribution in Bolivia in 2020 based on the available microdata. The dashed line is the cumulative income (left axis), colorful bars represent income of all percentiles (without accumulation, right axis).
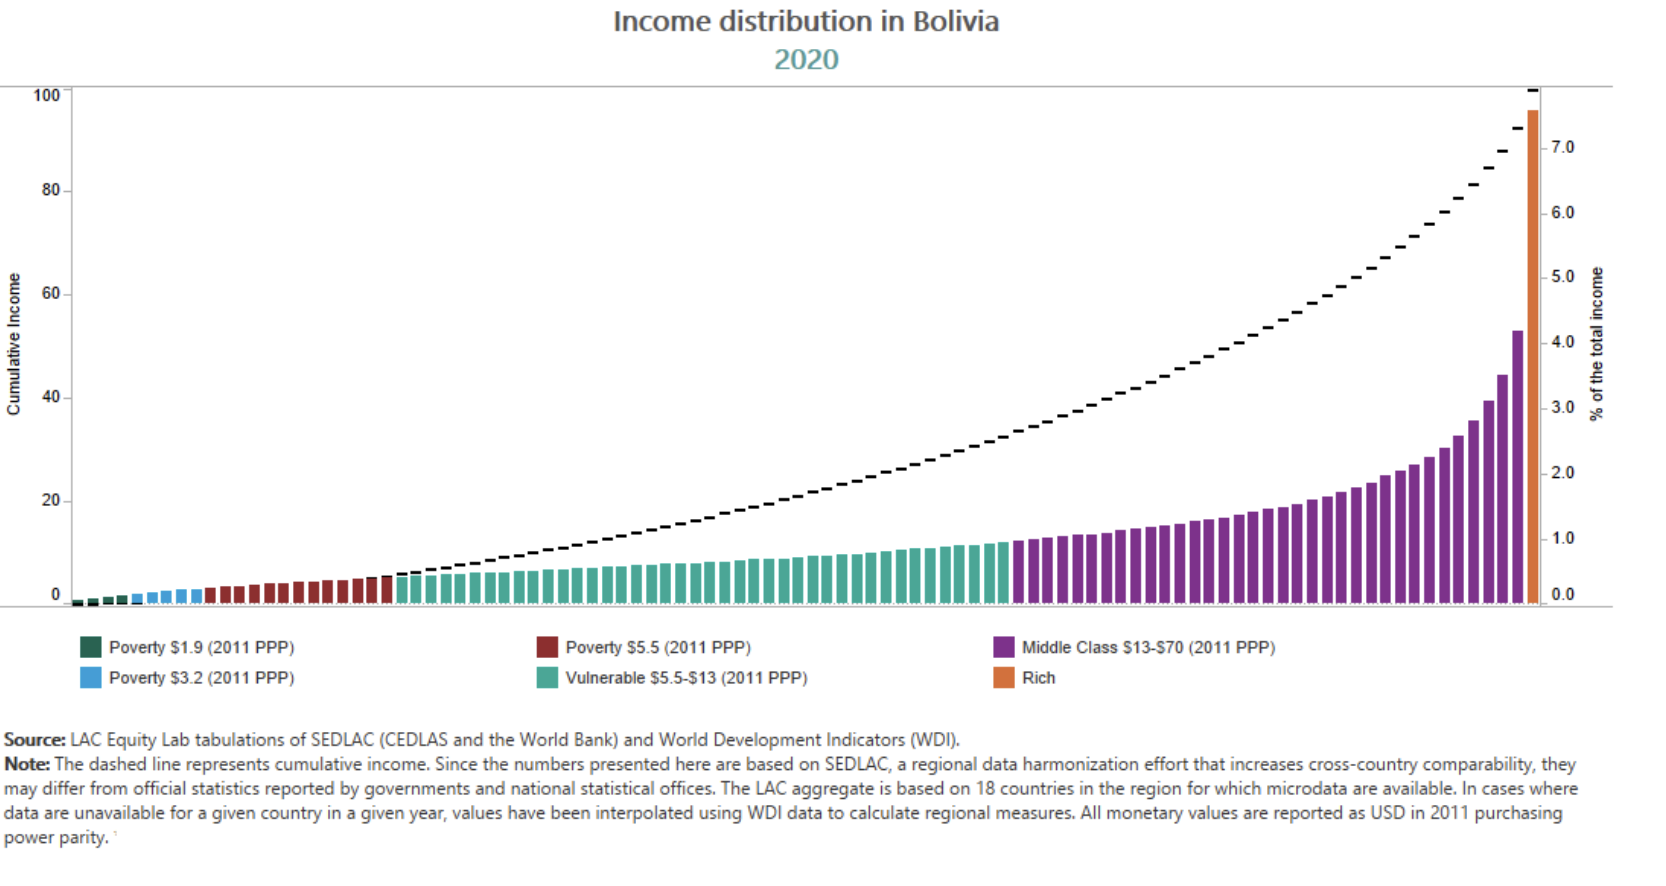
What is the closest estimate of the Gini Index?
Не то попробуйте другой вариант
Верно
Правильный ответ: . Ниже видно, что вы отмечали и что надо было.
попытка 1
1–4 выбрать · Enter проверить